I observe that the left column is obviously exponential, and the right column seemingly so. (Each item in the right column is somewhat more than three times the previous item.) So it makes sense to construct a log-log plot of the data:
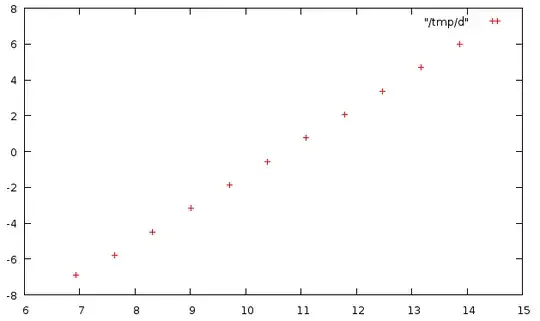
The $x$-axis is the logarithm of the left-hand column, and the $y$-axis is the logarithm of the right-hand column.
At this point it is obvious that the relationship between the logarithms of $x$ and $y$ is linear, so $\log y = m\log x + b$ where $m$ and $b$ are the slope and $y$-intercept of the plotted line. Linear regression gives $m\approx 1.88$ and $b\approx -20.086$:
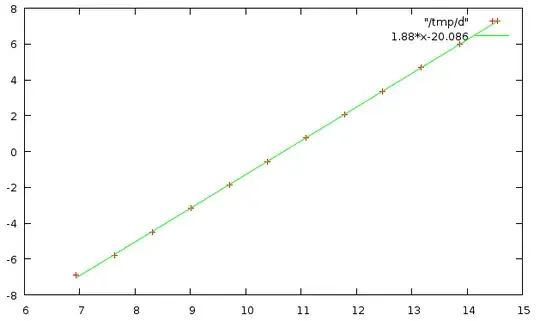
So we can write $$\begin{align}y & = e^{1.88\log x - 20.086}\\ & = \frac{x^{1.88}}{529108792}\end{align}$$
Checking $x=65536$ we get $y=2.145$ which is close to the $2.134$ in the table; had I rounded off the $1.88$ more carefully we might have gotten a more accurate result. The apparent zero value for $x=512$ is actually around $0.00023$.
For the linear regression I used a tiny program that I wrote in Perl a few years ago, but any handheld scientific or financial calculator will do it. I explained it in detail in this post.