If the mathematical definition on Wikipedia feel too abstract, then maybe this animated image can help. It helped me understand what a tangent is, maybe it can help you.
In the animation (link above), pay no attention to the mathematical formulas nor any of the number vaules. Focus on the line that is gliding along the curve. Remember that it, i.e. the tangent, is a tool to show you how much the function/curve is "rising" or "falling" at that specific point. When you look at the animation notice how the tangent-line shifts color between,
-$ \bf \color{green} {Green} $: for the parts of the function when its Y-value is increasing, i.e. climbing,
-$ \bf Black$: for the parts of the function when its Y-value is constant, i.e. terrace/ local maximum or minimum point,
-$ \bf \color{red} {Red}$: for the parts of the function when its Y-value is decreasing.
Notice also that the tangent does not have to extend infinity long from its point. In the picture below you will see a (green) tangent-line which can be made to extend further or be shortened, it doesn't matter, since its main function is to show you the angle of the slope at that specific X-value.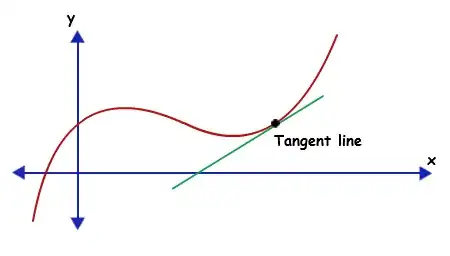
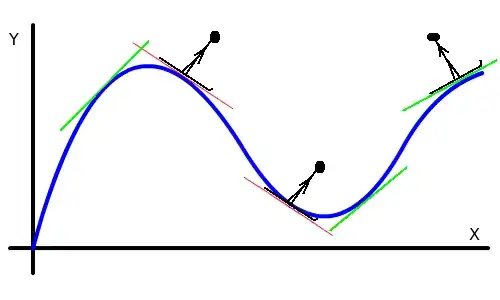
Finally here is how my teacher introduced me to tangent lines: "Think of the tangent line as the skis belonging to a person skiing on a curvy mountain (which is your function). The center of the skis are always parallel with the curve, and the skier is always standing perpendicular to the skis." See image below:

