2

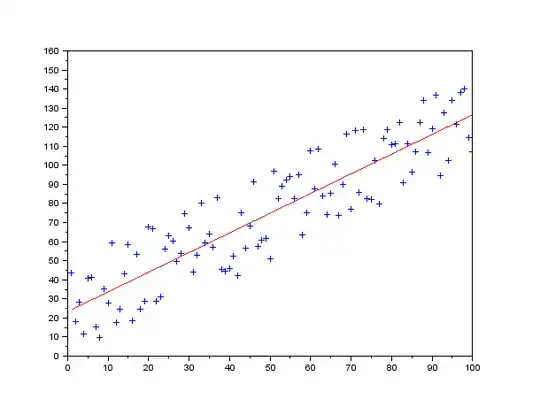
I have array of random numbers. How can I calculate linear regression segment? I am interested in finding the exact formula so I be able to use it in my work, please help me finding this formula with the next declarations:

  • $N$ - the number of random numbers in the array
  • $S$ - the sum of the numbers in the array.
  • $array_{min}$ - the minimum number in the array
  • $array_{max}$ - the maximum number in the array
  • $E$ - the average number in the array.

We are looking for $y = mx + c$. So you need to find a formula to represent $m$ and $c$ with the above declarations.

The array of random number are the $Y$. $X$ is just neutral numbers from $0$ to $N$

Ilya Gazman
  • 1,470
  • 1
    @Stefanos sorry, I eddied the question. – Ilya Gazman Mar 25 '14 at 11:39
  • To use the least squares method for the estimation of the two parameters you would also need the sumproduct $\sum x_iy_i$ for $i=1,...,N$. Do you have it? If you have it you are done. You do not need the minimum and the maximum of the array and the average E is straightforward if you have the sum S. – Jimmy R. Mar 25 '14 at 11:43
  • @Ilya, I still think you're asking exactly "how to find linear regression of Y and X". Do you want to get explanation on how to do this step-by-step? – werediver Mar 25 '14 at 11:46
  • @werediver yeah, sorry I just don't understand the wiki page – Ilya Gazman Mar 25 '14 at 11:46
  • 1
    Perhaps you should look at the other Wiki page: http://en.wikipedia.org/wiki/Simple_linear_regression, where you find some explicit formulas. – gammatester Mar 25 '14 at 12:06
  • @gammatester my math level is probably very law. I still don't get it. – Ilya Gazman Mar 25 '14 at 12:14
  • @gammatester, good reference. – werediver Mar 25 '14 at 12:19

1 Answers1

1

I've found an easy to follow explanation of the Linear regression method here: Introduction to Linear Regression by David M. Lane.

To check if this is what we need and actually not so complicated as it is on the Wikipedia, I've writen Scilab function (see below for the code and visualization).

The essential part is where $a$ and $b$ for $y'=a x + b$ are calculated.

function _linreg()
    // Based on http://onlinestatbook.com/2/regression/intro.html

    // Sample data set
    X = 1:100   // 1, 2, ..., 100
    // Y is a 45 degree line with noise (see the visualization)
    Y = X + rand(X) .* 50
    // Raw plot, the source data
    plot(X, Y, '+')

    function [r] = scc(X, Y)
        // Sample correlation coefficient
        // http://en.wikipedia.org/wiki/Correlation_and_dependence

        X1 = X - mean(X)
        Y1 = Y - mean(Y)

        r = sum(X1 .* Y1) / sqrt(sum(X1.^2) * sum(Y1.^2))
    endfunction

    a = scc(Y, X) * stdev(Y) / stdev(X)
    b = mean(Y) - a * mean(X)

    // Regression plot
    plot(X, a .* X + b, 'r')
endfunction

Linear regression example

werediver
  • 243
  • What mean(), plot() functions do? Sorry I am not familiar with this language. – Ilya Gazman Mar 25 '14 at 12:22
  • I understand most of it now. Can you just explain: r = sum(X1 .* Y1) – Ilya Gazman Mar 25 '14 at 12:27
  • I have removed a slightly redudand part of code for the sake of brevity. mean() gives the average value of an array, sum() gives the sum of the elements of array, stdev() gives the standard deviation. Dot-prefixed operators is elementwise. a .* b gives [a(1)*b(1), a(2)*b(2), ...]. – werediver Mar 25 '14 at 12:35