For this answer I'll assume that the sphere is projected onto a plane with coordinates $x,y$; that the center of the orthogonal projection has latitude (angle from the equator) $\phi_0$ on the sphere and longitude $\lambda_0$ and is projected to the point $(0,0)$ in the $x,y$ plane; that all angles are measured in radians; and that the poles of the sphere (points at latitude $\pm\frac\pi2$) are projected onto the $y$ axis.
Note that this is slightly different from the answer previously posted here, which uses $y$ where I use $x$ and $z$ where I use $y,$ but it is consistent with my answer to a different question, whose main figure I have re-used below.
Lines of Latitude
For a line of latitude, consider the figure below, depicting the projection of a sphere with pole $N$ and equator $EE'$ projected onto a plane with $x,y$ coordinates.
The center of the projection is point $P.$

We get the $(x,y)$ coordinates of each projected point simply by deleting the $z$ coordinate of the original point. So the pole $N$ projects to the point
$(0,r\cos\phi_0).$
The small circle at latitude $\phi$ projects to an ellipse with center
$(0,r\sin\phi\cos\phi_0),$ at the same $y$-coordinate as the point $M$ in the figure.
The radius of the small circle is $r\cos\phi,$ which is also the semimajor axis of the ellipse onto which the circle is projected; the major axis is parallel to the $x$ axis. The semiminor axis of the ellipse, which lies on the $y$ axis, has length
$r\cos\phi\sin\phi_0.$
The plane of the small circle intersects the $y$ axis at $(0,r\sin\phi\sec\phi_0),$ shown as point $T$ in the figure.
For a projection with a positive central latitude, as shown in the figure, any point on the small circle with $y$ coordinate greater than that of $T$ is on the "far" side of the sphere and is hidden in the projection.
In the case where $r\sin\phi\sec\phi_0 \geq r,$ that is, for
$\phi \geq \frac\pi2 - \phi_0,$ the entire ellipse is visible and not hidden.
In the case where $r\sin\phi\sec\phi_0 < -r,$ that is, for
$\phi < \phi_0 - \frac\pi2,$ the entire ellipse is hidden.
For other small circles, the part on or below the line $y = r\sin\phi\sec\phi_0$ is visible and the part above that line is hidden.
From either this answer
or this answer
we can find the longitudes of the points at which the line of latitude changes from visible to hidden (for latitudes that are only partially visible). These longitudes are
$$ \lambda = \lambda_0 \pm \arccos(- \tan\varphi\tan\varphi_0). $$
Lines of Longitude
A meridian (line of longitude) is half of a great circle on the sphere. To complete a great circle we can combine two meridians. Let $\Gamma_\lambda$ be the great circle that includes the meridian at longitude $\lambda$ with the meridian at longitude
$\lambda - \pi$ (or $\lambda + \pi,$ depending on $\lambda$ and your preferences for how to express the longitude of a meridian).
The great circle $\Gamma_\lambda$ passes through two diametrically opposite points on the great circle $\Gamma_P$ that lies in the plane $CT$ in the previous figure.
Since $\Gamma_P$ projects onto the circle of radius $r$ about $(0,0),$ which contains the rest of the projection of the sphere,
the projection of $\Gamma_\lambda$ is an ellipse that is internally tangent to the circle of radius $r$ about $(0,0).$
The semimajor axis of that ellipse therefore has length $r.$
A line through the center of the sphere perpendicular to the plane of
$\Gamma_\lambda$ intersects the sphere in two points known as the poles of the great circle.
Both of these points are on the equator; choose one at either longitude
$\lambda + \frac\pi2$ or $\lambda - \frac\pi2.$ Call that point $Q.$
The figure below shows the the orthographic projection of these shapes onto the $x,y$ plane. The north pole is projected to the point $N,$ the equator is projected to the ellipse through the point $Q$,
and the ellipse through $N$ is the projection of the great circle $\Gamma_\lambda$ of the meridian at longitude $\lambda.$
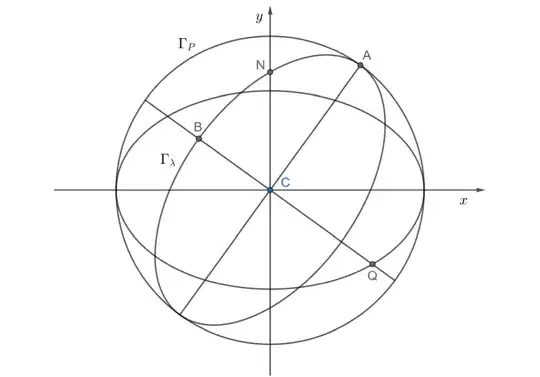
The coordinates of $Q$ in the projection are
$(x_Q,y_Q) = (r\cos(\lambda - \lambda_0), r\sin\phi_0\sin(\lambda - \lambda_0)).$
This implies that the semiminor axis $CB$ of the ellipse through $N$ has slope
$\dfrac{y_Q}{x_Q} = \sin\phi_0\tan(\lambda - \lambda_0)$
and the semimajor axis $CA$ has slope
$-\csc\phi_0\cot(\lambda - \lambda_0).$
The points $Q$ and $B$ on the original sphere are on another great circle that in this projection appears as a straight line segment.
On that circle, $Q$ and $B$ make right angles with the center of the sphere.
Their distances from the line $CP$ are therefore $r\sin\alpha$ and $r\cos\alpha$ for some angle $\alpha.$ In the projected image, therefore,
$CQ^2 + CB^2 = r^2\sin^2\alpha + r^2\cos^2\alpha = r^2.$
The semiminor axis $CB$ of the ellipse therefore has length
\begin{align}
\sqrt{r^2 - CQ^2}
&= r \sqrt{1 - \cos^2(\lambda-\lambda_0) - \sin^2\phi_0\sin^2(\lambda-\lambda_0)} \\
&= r \cos\phi_0\sin(\lambda - \lambda_0).
\end{align}
For $\phi_0 > 0,$ as shown in this example, the visible part of the great circle is the portion of the ellipse above the major axis and the portion below is hidden. If $\phi_0 < 0$ (so that $N$ is hidden) then the portion of the ellipse below its major axis is visible and the portion above is hidden.
From this answer
we know that the meridian at longitude $\lambda$ changes from visible to hidden at latitude
$$ \phi = -\arctan(\cot\phi_0 \cos(\lambda - \lambda_0)). $$
Note that (strictly speaking) this happens at only one point on a meridian, which is one of the vertices of the ellipse onto which the meridian is projected, because a meridian is only half a great circle and projects to only half of an ellipse. The other half of that ellipse, containing the other vertex, is the projection of the meridian at longitude $\lambda \pm \pi,$ whose visible-to-hidden transition occurs at latitude
$$ \phi = \arctan(\cot\phi_0 \cos(\lambda - \lambda_0)). $$
Summary
For the line of latitude $\phi,$
\begin{align}
\text{Center of ellipse} &= (0,r\sin\phi\cos\phi_0), \\
\text{Slope of major axis} &= 0, \\
\text{Length of semimajor axis} &= r\cos\phi, \\
\text{Length of semiminor axis} &= r\cos\phi\sin\phi_0, \\
\text{Longitude at end of visibility} &= \lambda_0 \pm \arccos(- \tan\varphi\tan\varphi_0), \\
\text{$y$ coordinate at end of visibility} &= r\sin\phi\sec\phi_0, \\
\text{Entire line visible if } &
\begin{cases}
\phi \geq \frac\pi2 - \phi_0 & \phi_0 > 0, \\
\phi \leq -\frac\pi2 - \phi_0 & \phi_0 < 0, \\
\end{cases} \\
\text{Entire line hidden if } &
\begin{cases}
\phi < -\frac\pi2 + \phi_0 & \phi_0 > 0, \\
\phi > \frac\pi2 + \phi_0 & \phi_0 < 0.
\end{cases}
\end{align}
For the meridian at longitude $\lambda,$
\begin{align}
\text{Center of ellipse} &= (0,0), \\
\text{Slope of major axis} &= -\csc\phi_0\cot(\lambda - \lambda_0), \\
\text{Length of semimajor axis} &= r, \\
\text{Length of semiminor axis} &= r \cos\phi_0\sin(\lambda-\lambda_0), \\
\text{Latitude at end of visibility} &= -\arctan(\cot\phi_0 \cos(\lambda - \lambda_0)).
\end{align}

