I have been following this tutorial: https://dkopczyk.quantee.co.uk/vqe/
I am using Cirq to try to teach myself VQE, replicate their results, and also try to understand more about ansatz for molecular simulations - and just for plain fun!
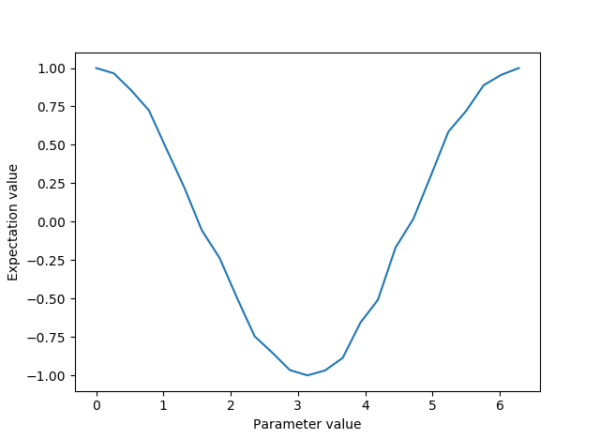
Here's the thing though, while I can match expectation values, the graph I find for their angle range does not match their result.
What am I doing wrong and\or not getting about minimization? My code:
def small_ansatz(parameter_y, qubit):
  ygate = cirq.YPowGate(exponent=parameter_y)
  #ygate = cirq.YPowGate(exponent=parameter_y)
  #yield xgate(qubit)
  yield ygate(qubit)

#wrapping into a circuit

def psi_circuit(parameter):
  curr_q = cirq.LineQubit(0)
  curr_c = cirq.Circuit()

  curr_c.append(small_ansatz(parameter, curr_q))

  curr_c.append(cirq.measure(curr_q, key='q0'))
  return curr_c

def expectation_value_vqe(param, num_reps):
  curr_psi = psi_circuit(param)
  print()
  #keep the measured keys and values

  curr_simulator = cirq.Simulator()
  curr_results = curr_simulator.run(curr_psi, repetitions=num_reps)
  s_k, s_v= zip(*r.measurements.items())

  #convert into booleans from sp|in values
  curr_state_values = 1 - 2*np.array(s_v).astype(np.int32)

  #get the expectation value (the average of the counts)
  #I keep double the variables because I want to remind myself of the distinction between this task and the context
  #of Farhi's paper.
  curr_predicted_label_value = np.mean(curr_state_values)
  return(curr_predicted_label_value)
And the plot I get for my expectation values for the ansatz:
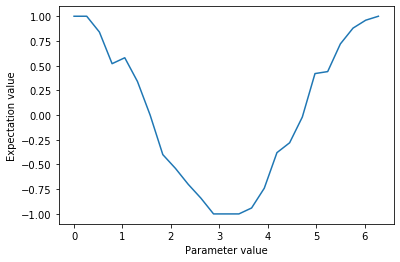
And here is the tutorial:
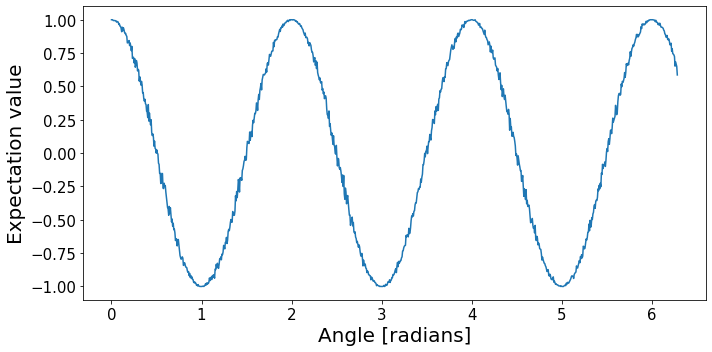
Edit: I also implemented this on Qiskit and did obtain the plot to match Grove's.