6

I'm not a mathematician, but a geographer trying to get a grasp on some network analysis I'm experimenting with. I have a few questions related to spectral graph theory that a mathematician could help me with:

I'm generating random graphs of 50 nodes and density 0.17 that have particular average path length, modularity, etc. Each of these graphs produce spectra (distribution of eigenvalue) resembling this:

Distribution of eigenvalue for a random graph

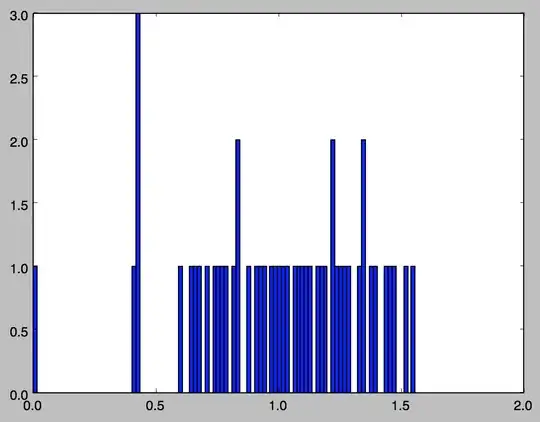
From a novice point of view, I am tempted to tell that a semi-circle shape, if weak, is forming between eigenvalues 0.6 and 1.55.

  • What would that mean? Is this related to the typical semi-circle seen in random graphs?
  • What about the peak at eigenvalue 0.4? Could it be the second eigenvalue, which is often related to algebraic connectivity?
  • Are the values close to zero typical of anything?

To broaden the question, how much can one conclude, in terms of graph structure, from looking at the spectrum of a graph (laplacian or otherwise)? This may seem naive, but can one ever use a graph spectra (perhaps averaged over many graphs) as a structural signature?

Lucien S.
  • 217
  • 1
  • 8
  • The answer depends the on (1) random distribution, eg BernoulliGraphDistribution[n,p] and (2) the spectrum, eg Adjacency, signed or unsigned Laplacian - can even interpolate between these 2 extremes, and really should also consider SVD of the incidence matrix. Each of these measures a different aspect of graph topology. – alancalvitti Jan 15 '15 at 19:02
  • Related: http://math.stackexchange.com/questions/179257/questions-on-fractional-laplacian-graph-spectra – alancalvitti Jan 15 '15 at 19:04
  • Email me if you'd like to see additional examples, though at some point might even post them as Q. – alancalvitti Jan 15 '15 at 19:10

1 Answers1

5

It is known that the spectrum of random graphs obeys a semicircular law. Since your graphs are random, your observations do not seem surprising. The form of the eigenvalue density function is largely controlled by the number of closed walks in the graph with length $k$, for small values of $k$. This means that plots like yours will expose information about these walks, giving you information about average valency, average huber of triangles on a vertex, and so on. In general the spectrum does not determine the graph. For example, the probability that a tree on $n$ vertices is determined by its spectrum goes to zero as $n\to\infty$. It is conjectured that the probability that a random graph is determined by its spectrum goes to 1 as the number of vertices increases.

Chris Godsil
  • 14,053
  • Thanks @Chris, this enlightens me quite a bit. Do you have an explanation about the peak at 0.4? It's possibly connected to the algebraic connectivity -which is said to be the second lowest eigenvalues-, but why would there be a high number of eigenvalues in the vicinity of the second lowest eigenvalues? – Lucien S. Sep 28 '14 at 18:47
  • 1
    @rudolphe: the piling up in the neighbourhood of thr second eigenvalue is intriguing; it suggests that there is some common structure to your "random" graphs. – Chris Godsil Sep 28 '14 at 21:46