2

Background: I asked this question on Stack Overflow about how to program in Java or VBA a method to calculate asymptotes given a range of data points. I believe the underlying question would be more appropriate here than on SO - if I understand the statistical way of solving the problem, I will be able to solve it programmatically.

Problem: We are given $n \in [5,15]$ numbers on the interval $]0,1]$ that are the measured approximations of some real-life phenomena, call them $s_1, s_2, \cdots, s_n$. They tend to be decreasing so that $s_i<s_{i+1}$ (although they are approximations so that it's not always so). Looking at them on a graph, we see that it appears they have a horizontal asymptote as $n \rightarrow \infty$. Example:

i   value
-   -
1   0.8232
2   0.6032
3   0.5012
4   0.4646
5   0.45001
6   0.44981

which gives the following chart

Excel chart

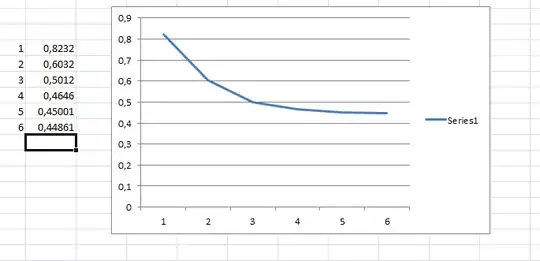
The horizontal asymptote would be $y=a$ with $a$ being some number less than $s_n$. In this case, it seems like $a$ is close to $0.44$. I have two questions:

  1. How do we find this asymptote if we do not know the underlying distribution? (I guess we assume the formula $e^{ax}+b$, is this true?)

  2. How do we find the asymptote for some confidence interval, say 95%? Do we then assume that the measurements are accurate or should we assume that each $s_i$ follows a normal distribution on its true value for some low standard deviation $\sigma_i$ (so that the chance that the true value corresponding to $s_i$ has a 67% change of being within $[s_i-\sigma_i,s_i+\sigma_i]$)?

Sid
  • 4,422

1 Answers1

2

Instead of fitting the function, fit the first (positive) differences $d_i=s_{i-1}-s_{i}$

Edits based on OP comments

While addressing OP's comments, I happened upon an easier approach that I liked better:

Since the sequence of $s_i$ are decreasing, let's model each $s_i$ as the asymptote $\theta$ plus a positive term $\epsilon_i$ such that $s_i=\epsilon_i+\theta$. This implies that $d_i=s_{i-1}-s_i = \epsilon_{i-1}-\epsilon_i$. Since your function that you are approximating appears to have a discrete domain, we should instead model the first positive differences as a geometric sequence: $d_i=ar^i$. This implies that $s_i=s_1-\sum\limits_{j=1}^{i-1} d_i = s_1-\sum\limits_{j=1}^{i-1} ar^i$.

Fitting the geometric model to the first differences and minimizing sum of squares, I get: $\hat d_i =0.519(0.428)^i$. Now, $\theta = \lim\limits_{i\rightarrow \infty} s_i = s_1-\sum\limits_{j=1}^{\infty} d_i = s_1-\sum\limits_{j=1}^{\infty} ar^i=s_1 - \frac{ar}{1-r}=0.8232-0.38753 = 0.435627$, which is quite close to your intuition. See here for geometric series sums

I did the same calculation starting at each of the other six $s_i$, where I subtract $\hat d_{i-1}$ from $0.38753$ since we are now starting at $i=2,3,4...$:

$\hat \theta_i = s_i-[\frac{ar}{1-r}- \sum\limits_{j=1}^{i-1} d_j]$ where $\theta_i$ is the estimate of $\theta$ starting at $s_i$.

I got the following values:

$\{0.435627133,\;0.437502142,\;0.430359695,\;0.434313858,\;0.437061857\}$

Therefore, our range of estimates is approx $[0.430,0.438]$. I don't think you have enough data points to really do much proper inference, but as you can see the range is pretty small (although these values are correlated, of course).

Anyway, I think this is a cleaner analysis than my first one and easier to implement on a non-statistical computer language (C++ or JAVA).

  • Thanks for your help. I'm not up to speed on the Least Squares Estimate method. Can you clarify how you arrived at your first equation (what program did you run this through? also, where did you leave the constant $c$ that was in the formula $y=a e^{bx} + c?$), how you arrive at 0.012 for your MLE (maximum likelihood estimate?) and most importantly, how we reach the number .44861 in your last line? – Sid Jul 18 '14 at 22:36
  • @Sid I redid the analysis because I realized that a geometric series is a much cleaner model for your data. –  Jul 19 '14 at 02:03
  • Nice, now I understand. It would be a bit time-consuming but I could write some Java code that performs LSE on $y=ar^i$, although it would be preferable to use a library function or some program that does it for me (Excel?). What did you use? – Sid Jul 19 '14 at 11:45
  • @Sid I used excel's solver (GRG algorithm) –  Jul 19 '14 at 15:39