So in the bifurcation diagram of the logistic map, there is period doubling from about $r=3$ to about $r=3.54409$. There are two fluctuation points between $r=3$ and $r=1+\sqrt{6}$. My question is, how would one obtain the $r$ value of $1+\sqrt{6}$?
Asked
Active
Viewed 1,424 times
1 Answers
8
The Logistic Map is given by:
$$f(x) = r~ x~ (1-x),~~ x \in [0,1]~,~ r > 0$$
Taking the 2-cycle, we solve:
$$f^2(x) = x$$
A plot of $f^2(x)$ and the line $x$ is:
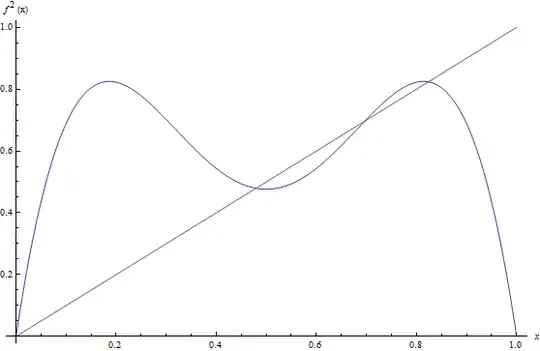
This gives us the four roots:
$$x = 0, 1 - \dfrac{1}{r}, \dfrac{r+1 ~\pm ~ \sqrt{(r-3)(r+1)}}{2r}$$
The first two are repelling points and the second two are periodic points.
We now want to find the range of stability for those two points. For stability:
$$(f^2)'(x_0) = f'(x_1)f'(x_0)$$
where $x_1 = f(x_0)$.
When $x_0 = \dfrac{r+1 ~\pm ~ \sqrt{(r-3)(r+1)}}{2r} \implies (f^2)(x_0) = 4 + 2 r - r^2$.
Therefore, the 2-cycle is attracting when:
$$ |4 + 2 r - r^2| \lt 1$$
- For the positive absolute value we have $(4 + 2 r - r^2) \lt 1 \implies r \gt 3$
- For the negative absolute value we have $-(4 + 2 r - r^2) \lt 1 \implies r \lt 1 + \sqrt{6}$
This gives stability when:
$$ 3 \lt r \lt 1 + \sqrt{6}$$
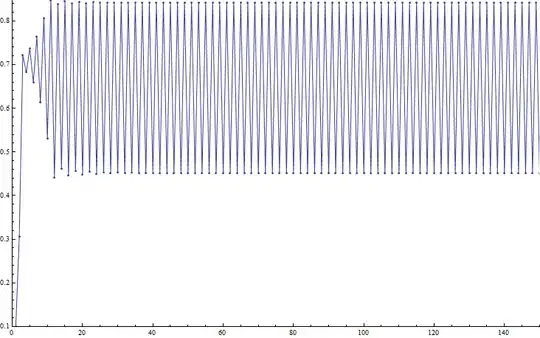
If we plot a time series of $x_n$ versus $n$, for a value of $r = 3.4$, we can see this 2-cycle as:
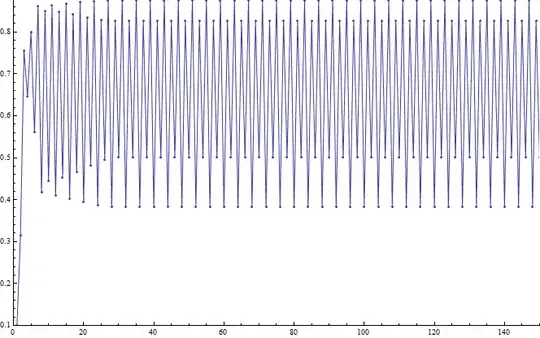
However, if we do the same plot for $r = 3.5$, we now see a 4-cycle as:
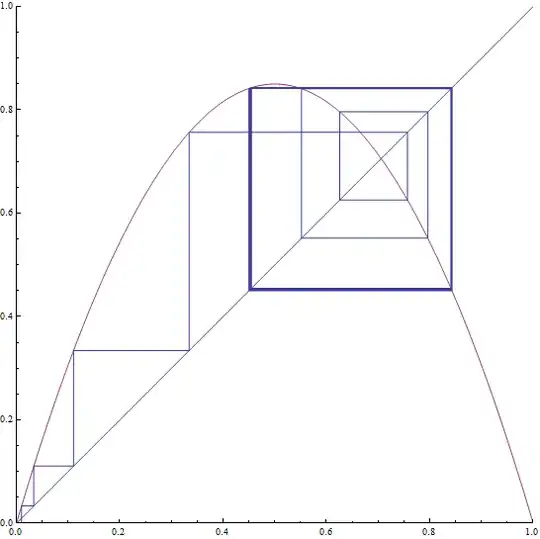
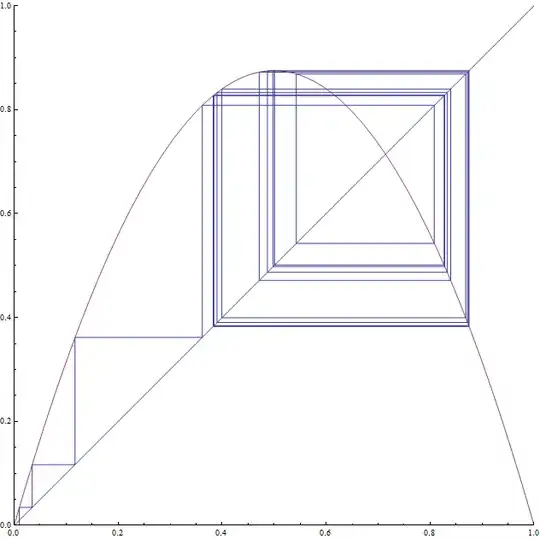
If we plot the cobweb of each, we can see the stable 2-cycle, versus the 4-cycle as:
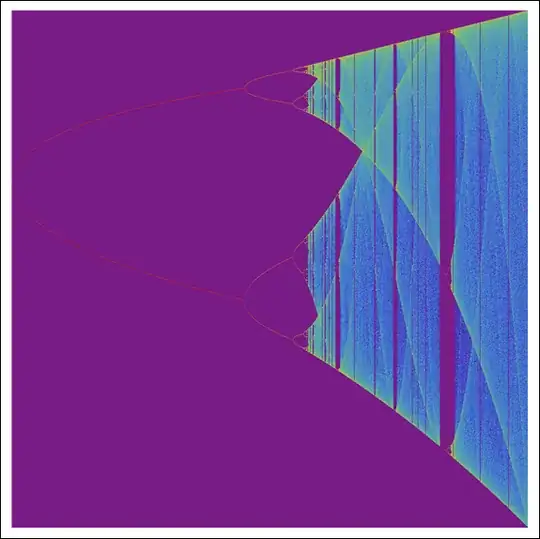
We can also plot the bifurcation diagram of the logistic map as:
Amzoti
- 56,629