I ended up finding what I think is an exact solution.
Let $\sigma$ a plane that passes through the origin $O$, where the normal vector is described by the point $S$. The neighbors of $S$ are in the surface of a spherical cap with a base parallel to $\sigma$.
A random unit vector $V$ parralel to $\sigma$ may be obtained by projecting a random point in the sphere surface onto $\sigma$ and normalizing.
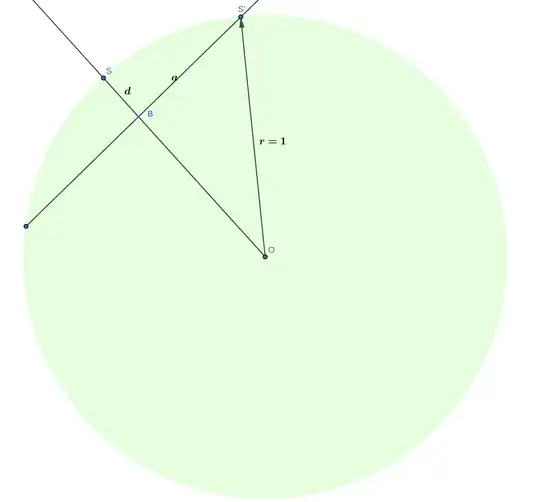
If we take $d$ as the minimum distance from $S$ to the center of the sperical cap base $B$, we can determine $||OB||=1-d$ and the maximum distance to a neighbor $S'$ of $S$ (in the spherical cap) as $||BS'||=\sqrt{1-(1-d)^2}$ with Pythagoras theorem. The distance of $S$ to $S'$ can also be determined with Pythagoras theorem: $||SS'||=\sqrt{2d}$.
Taking last two paragraphs into account, a random neighbor $S'$ of $S$ at a distance $||SS'||=D$ can be obtained as $OB+V||BS'||$, as all the unknowns can be obtained with $d$ which can be obtained by $d=D^2/2$. If a value $D'$ is chosen from a random uniform in $[0,D]$, and then $S'$ is obtained for that $D'$, then $d(S,S')$ will follow a uniform distribution in $[0,D]$. Here goes a graphic representation, (you have to imagine a sphere).
Here goes some Python code for those interested:
import numpy as np
from numpy.linalg import norm
from mayavi import mlab
https://math.stackexchange.com/questions/1585975/how-to-generate-random-points-on-a-sphere
def random_point_in_sphere(n):
    vec = np.random.randn(n)
    vec /= norm(vec)
    return vec
https://stackoverflow.com/questions/9605556/how-to-project-a-point-onto-a-plane-in-3d
def random_vector_on_plane(normal_vec):
    # Get a random point in sphere and project it to the plane
    P = random_point_in_sphere(normal_vec.shape[0])
    dist = np.dot(P, normal_vec)  # distance from P to plane along the normal
    vec = P - dist*normal_vec
    vec /= norm(vec)
    return vec
Generate neighbor S' of S in the same sphere surface such that the euclidean
distance d(S,S') follows a uniform distribution in [0, d]
def generate_neighbor(S, d):
    # a value of d describes a spherical cap, its height is d2/2
    cap_height = np.random.uniform(0, d)2 / 2
    # Generate a direction on plane parallel to spherical cap base
    D = random_vector_on_plane(S)
    # Point on shperical cap perimeter built as sum of two vectors:
    # 1. Vector from origin to S that stops at cap base
    # 2. Random vector parallel to cap base. Its length can be computed with
    # the use of pythagoras theorem.
    neighbor = S * (1-cap_height) + Dnp.sqrt(1-(1-cap_height)*2)
    return neighbor
Test that the generate neighbor function works correctly
n = 10  # 10-sphere
n_exp = 50000
n_points = 50
d = 0.5
test_points = np.array([random_point_in_sphere(n) for _ in range(n_points)])
means_distances = []
std_devs_distances = []
max_distances = []
for S in test_points:
    distances = []
    for _ in range(n_exp):
        neighbor = generate_neighbor(S, d)
        distances.append(np.linalg.norm(S-neighbor, ord=2))  # eucl. distance
    means_distances.append(np.mean(distances))
    std_devs_distances.append(np.std(distances))
    max_distances.append(np.max(distances))
print(f'Mean of euclidean distance: {np.mean(means_distances)}'
      f' expected: {d / 2}')
print(f'Std.dev. of mean across experiments (expected near 0): '
      f'{np.std(means_distances)}')
print(f'Std.dev. of euclidean distance: {np.mean(std_devs_distances)}'
      f' expected: {np.sqrt(d**2 / 12)}')
print(f'Std.dev. of std.dev across experiments (expected near 0): '
      f'{np.std(std_devs_distances)}')
print(f'Maximum distance encountered: {np.max(max_distances)}')
It outputs:
Mean of euclidean distance: 0.25000092324558143 expected: 0.25
Std.dev. of mean across experiments (expected near 0): 0.0004582988807651125
Std.dev. of euclidean distance: 0.1443138166035262 expected: 0.14433756729740643
Std.dev. of std.dev across experiments (expected near 0): 0.00028820418816544
Maximum distance encountered: 0.4999995726161469
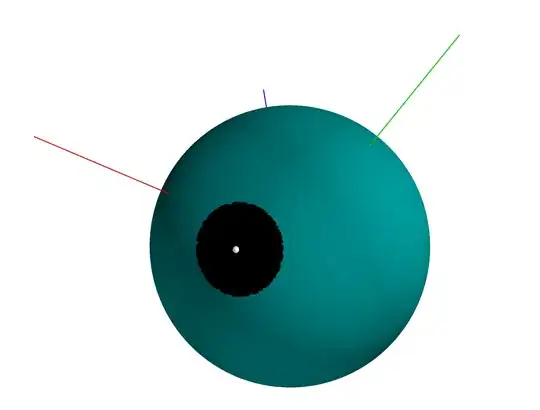
A visualization for $n=3$ was also made for many neighbors (black) of $S$(white):
# https://stackoverflow.com/questions/31768031/plotting-points-on-the-surface-of-a-sphere-in-pythons-matplotlib
r = 1
phi, theta = np.mgrid[0:np.pi:101j, 0:2 *np.pi:101j]
x = r*np.sin(phi)*np.cos(theta)
y = r*np.sin(phi)*np.sin(theta)
z = r*np.cos(phi)
mlab.figure(1, bgcolor=(1, 1, 1), fgcolor=(0, 0, 0), size=(400, 300))
mlab.clf()
mlab.mesh(x , y , z, color=(0.0,0.5,0.5), mode='axes')
Generate S and some S'
S = random_point_in_sphere(3)
d = 0.3
neighbors = np.array([generate_neighbor(S, d) for _ in range(10000)])
Add S and its neighbors to plot
xx, yy, zz = neighbors[:, 0], neighbors[:,1], neighbors[:,2]
mlab.points3d(xx, yy, zz, scale_factor=0.02)
mlab.points3d(S[0], S[1], S[2], scale_factor=0.05, color=(1, 1, 1))
Show x,y,z axes (there should be a better way to do this)
mlab.points3d(np.linspace(1, 2, 100, dtype=float), [0]100, [0]100,
              scale_factor=0.01, color=(1, 0, 0))
mlab.points3d([0]100, np.linspace(1, 2, 100, dtype=float), [0]100,
              scale_factor=0.01, color=(0, 1, 0))
mlab.points3d([0]100, [0]100, np.linspace(1, 2, 100, dtype=float),
              scale_factor=0.01, color=(0, 0, 1))
mlab.show()