8

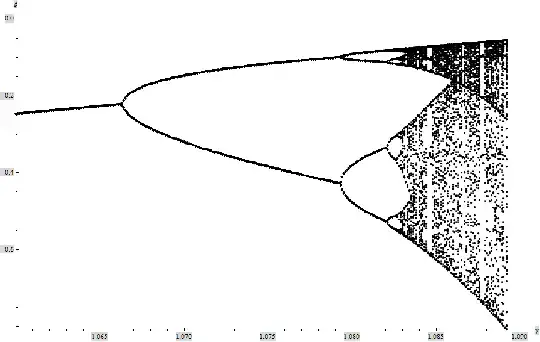
I have been studying the Duffing oscillator rather intensively lately, mainly based on the theory in of the book by Guckenheimer and Holmes. From all that I have gathered, it seems that most dynamical systems show a period doubling cascade before going into chaos. For example, the logistic map and the driven damped pendulum show this behavior. For instance, this a bifurcation diagram for the pendulum: enter image description here

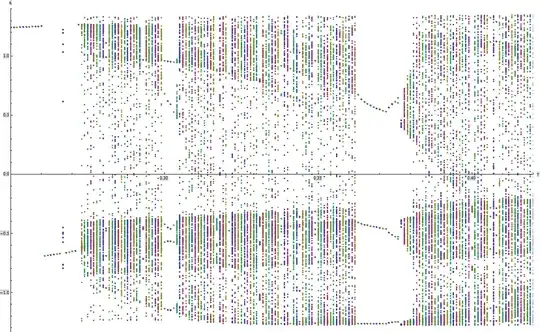
However, when I calculate numerical solutions of the Duffing oscillator with Mathematica, I am unable to find such a period doubling and the system goes into chaos right away, as this bifurcation diagram shows: enter image description here

Now I have tweaked and played with parameters and initial values, calculated some parts in more detail, but whatever I try, I still cannot find any period doubling. I find this very puzzling, since apparently period doubling does take place for the Duffing oscillator, according to Guckenheimer and Holmes. Also, I thought that it was a universal phenomenon for chaotic systems. I could not come up with any reason why I fail to find it other than shortcomings of the numerical method of Mathematica I used (I simply used NDSolve and ParametricNDSolve). Could there be any other reason why a period doubling is absent?

PianoEntropy
  • 2,776
  • The plot you show looks like it's zoomed in on a section in the chaotic range (specifically, one that shows a period 3 oscillation characteristic of these systems after chaos). It looks like your plot starts at a control parameter value of about 0.25, is this correct? At what value did you start your simulations? It's possible you missed the period doubling. – Nigel Jun 04 '13 at 00:02
  • I started simulations at $\gamma=0$, and didn't find any period doubling in the region $\gamma \in [0,0.25]$. The plot starts just before the first instances where I began to see chaos. I also zoomed in further just before the onset of chaos and didn't find period doubling there either. – PianoEntropy Jun 05 '13 at 14:11
  • Assuming your other parameters were in the right range, then you're probably right, it must be something about the method. In your plot, I see period doubling branches missing (in the periodic section starting at around 0.36), so perhaps that points to a problem where not all solutions are being found. Maybe not enough initial conditions? – Nigel Jun 05 '13 at 23:02

2 Answers2

1

When drawing bifurcation diagrams, there is a trade-off between speed and resolution. If you iterate more, you get a better picture but it takes longer. In your case, your program iterates too few that you can't get a clear picture about what is happenning. So you should increase your iterations for each parameter value.

Additionally, period doubling is just a bifurcation type. There are other bifurcations leading to chaos. You can check tent map about that.

0

The plot of logistic function is modified. Some points are removed from diagram ( preperiodic points)

Algorithm for each parameter value along horizontal axis :

  1. start with x0
  2. make n iterations (now you have xn) and do not draw points
  3. make k more iterations from x(n) to x(n+k) and drow these k points

See also here

HTH

Adam
  • 1,776