I'm experimenting with prediction interval (PI) over univariant time-data using skforecast pythonic package..
in the documentation it is mentioned that:
Prediction intervals
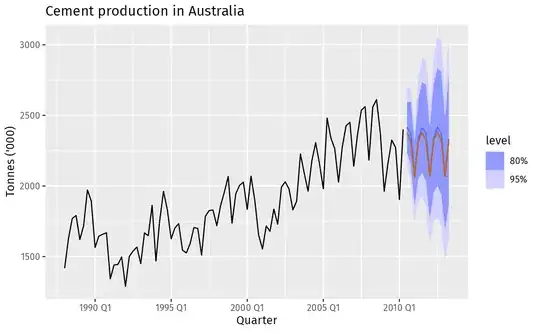
A prediction interval defines the interval within which the true value of the target variable can be expected to be found with a given probability. Rob J Hyndman and George Athanasopoulos, in their book Forecasting: Principles and Practice, list multiple ways to estimate prediction intervals, most of which require that the residuals (errors) of the model to be normally distributed. If this cannot be assumed, one can resort to bootstrapping, which requires only that the residuals be uncorrelated. This is one of the methods available in skforecast. A more detailed explanation of prediction intervals can be found in the Probabilistic forecasting: prediction intervals and prediction distribution user guide.
in user guide I found helpful info about bootstrapping method works based on $y_t=\hat{y}_{t \mid t-1}+\epsilon_1$ and prediction intervals can be computed by:
calculating the $\alpha / 2$ and $1-\alpha / 2$ percentiles at each forecasting horizon
but still, I can't figure out:
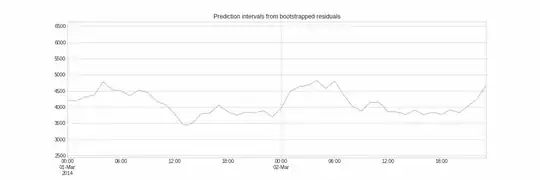
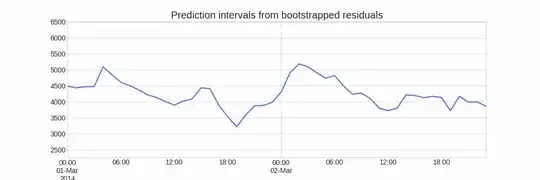
- Why are the PI outputs (gray lines) so different for certain setups like the below?
# Predict intervals for the next 7 steps, quantiles 10th and 90th
# ==============================================================================
predictions = forecaster.predict_interval(
steps               = 7,
n_boot              = 10,           # iterations
interval            = [10, 90],     # quantiles 10th and 90th [80% interval]
random_state        = 123,          # for reproducibility
...
)
Based on the picture in userguide:
- How final PI output (pink interval) is computed out of the rest of Bootstrapped PIs?:
 |
 |
|---|---|
| Fig. 1: Diagram of how to create prediction intervals using bootstrapping. ref | Fig. 2: PI for Bootstrapping residuals. ref |
- why PI distribution per step is so different?
Distribution for 1st step is low width and the last one is so wider! Distribution-wisely I found a similar post

# Ridge plot of bootstrapping predictions
# ==============================================================================
_ = plot_prediction_distribution(boot_predictions, figsize=(7, 4))
Related materials found: