I couldn't find an URL text file for the ILSVRC2012 training set, but for complete imagenet you can download the URLs only as a text file: http://image-net.org/download
I wrote the following script to get a feeling for the data:
#!/usr/bin/env python
"""Analyze the distribution of classes in ImageNet."""
classes = {}
images = 0
with open("fall11_urls.txt") as f:
for i, line in enumerate(f):
label, _ = line.split("\t", 1)
wnid, _ = label.split("_")
if wnid in classes:
classes[wnid] += 1
else:
classes[wnid] = 1
images += 1
# Output
print("Classes: %i" % len(classes))
print("Images: %i" % images)
class_counts = [count for _, count in classes.items()]
import matplotlib.pyplot as plt
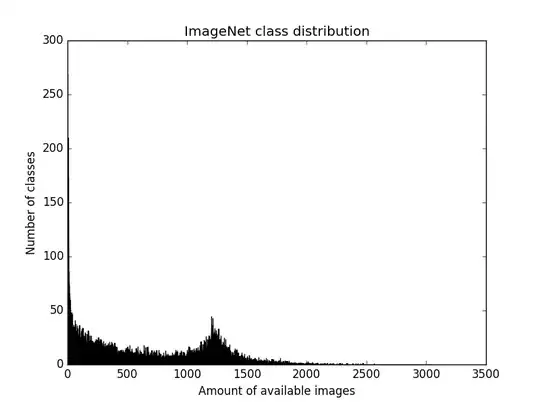
plt.hist(class_counts, bins=range(max(class_counts)))
plt.show()
which gave:
Classes: 21841
Images: 14197122
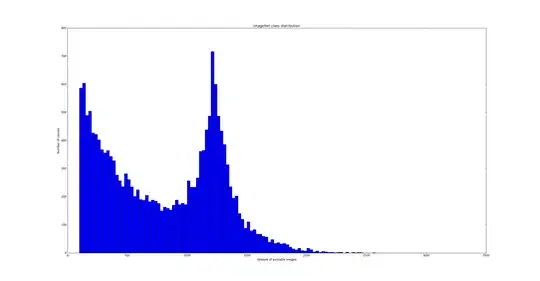
Classes which have less than 100 examples are pretty much useless. Lets remove them from the plot. Also increase the bin size to 25:
#!/usr/bin/env python

"""Analyze the distribution of classes in ImageNet."""

classes = {}
images = 0

with open("fall11_urls.txt") as f:
    for i, line in enumerate(f):
        label, _ = line.split("\t", 1)
        wnid, _ = label.split("_")
        if wnid in classes:
            classes[wnid] += 1
        else:
            classes[wnid] = 1
        images += 1

# Output
print("Classes: %i" % len(classes))
print("Images: %i" % images)

class_counts = [count for _, count in classes.items()]
import matplotlib.pyplot as plt
plt.title('ImageNet class distribution')
plt.xlabel('Amount of available images')
plt.ylabel('Number of classes')
min_examples = 100
bin_size = 25
plt.hist(class_counts, bins=range(min_examples, max(class_counts), bin_size))
plt.show()
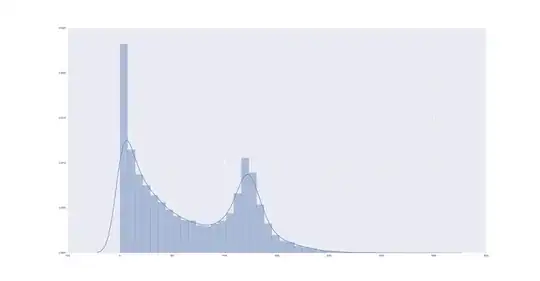
Or with seaborn:
import seaborn as sns
sns.distplot(class_counts, kde=True, rug=False);
sns.plt.show()
Top 10
The top 10 classes with most data are:
top10 = sorted(classes.items(), key=lambda n: n[1], reverse=True)[:10]
for class_label, count in top10:
    print("%s:\t%i" % (class_label, count))

n02094433:    3047 (Yorkshire terrier)
n02086240:    2563 (Shih-Tzu)
n01882714:    2469 (koala bear, kangaroo bear, native bear, )
n02087394:    2449 (Rhodesian ridgeback)
n02100735:    2426 (English setter)
n00483313:    2410 (singles)
n02279972:    2386 (monarch butterfly, Danaus plexippus)
n09428293:    2382 (seashore)
n02138441:    2341 (meerkat)
n02100583:    2334 (vizsla, Hungarian pointer)
Using http://www.image-net.org/api/text/wordnet.synset.getwords?wnid=n02094433 you can look the names up.


