1

I am following and expanding upon previous work from the winner of the Melanoma Classification from here.

The dataset has 9 classes. The competition is only interested in the one class (Melanoma).

I have taken the feature outputs (pre-final layer) from CNN and performed clustering. Then used this to group different classes (leaving Melanoma as its own group) then used this in the training.

I have already performed clustering with other steps (PCA, TSNE, K-Means, Hierarchichal, LDA, QDA, NDA, etc.) and have results. I am largely trying to understand the maths (and background research) behind why this approach in retraining might improve performance (on the ROC-AUC of the class that was not grouped ie. melanoma)

Any advice / relevant papers welcome!

Thanks,

Adrian B
  • 308
  • 1
  • 10

3 Answers3

3

Clustering might not be useful since the goal is improving a supervised learning metric (ROC-AUC) and all the data already has labels.

It might be better to manually create Melanoma / Not Melanoma categories based on existing labels and then build an end-to-end deep learning system with multi-model information. This would automatically learn to weight the most important features for the task.

Brian Spiering
  • 23,131
  • 2
  • 29
  • 113
2

I would agree with Brian's answer in the following sense:

All the steps you perform ie embedding, clustering, retraining,.. do not represent, in principle, qualitatively different math operations than what a dedicated deep model with non-linearities can do.

So, in this sense, I do not expect to get radically different performance than using a single NN model trained end-to-end.

That being said, whatever approach one uses (as I expect them to be equivalent) one will possibly have to deal with class imbalance wisely.

Nikos M.
  • 2,493
  • 1
  • 7
  • 11
1

Applying dimensional reduction could help understand why the neural network has made classifications, but we have to deep dive into the results using analytics.

In this example from Restnet50, you can see the UMAP result at each step. If you take the flattened one, you can see some outliers in different clusters. You would have something similar for the Melona classification.

The advantage of using UMAP is to detect why some classifications are wrong and why they are far from their correct cluster.

Therefore, you can get the ranges of each cluster (min and max values) and compare them with the wrong classified results.

For instance, if there is a wrongly classified melanoma in a cluster and you find out that the age was very different from the other cluster's age, you might emphasize the "age weight" with a power factor.

Unfortunately, it could be quite complex to do because all features are inter-dependants, and modifying one feature could have unforeseeable impacts on the others.

That's why many researchers try many potential solutions and choose the best one, without having a rigorous scientific approach because of the noise in the human-made data and the important quantity of learning iterations + the use of different modules.

In conclusion, applying dim reduction could give you a better understanding of a model and find new ideas to improve it thanks to the clusters' organization (overall in UMAP, where there is meaningful logic between clusters places), but such improvement could be very complex and could require many trials and fails.

Here are interesting articles about NN interpretability:

https://www.kaggle.com/code/subinium/interpretable-cnn-with-shap-mnist

https://towardsdatascience.com/dense-or-convolutional-part-2-interpretability-c310a9fd99a5

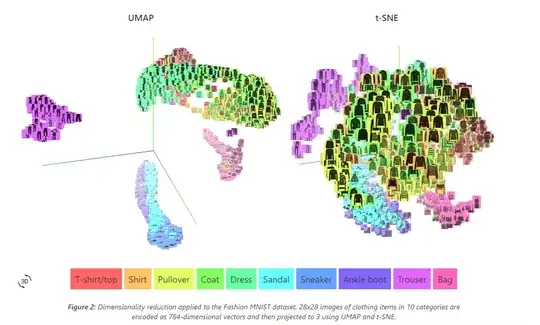
In this picture, you can see that UMAP has meaningful placement between clusters. enter image description here

Nicolas Martin
  • 5,014
  • 1
  • 8
  • 15