I am using MPAndroidChart, this is the chart I need to create:
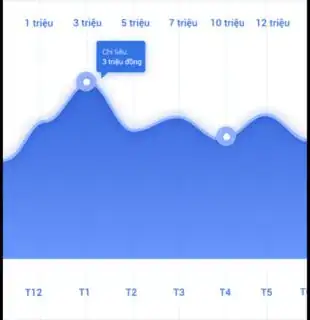
Hi everyone. Please help me. I'm trying to customize this chart but I can't make it come be better. have some problems:
- How to add new axis at bottom chart?
- How to hide horizontal lines?
I am using MPAndroidChart, this is the chart I need to create:
Hi everyone. Please help me. I'm trying to customize this chart but I can't make it come be better. have some problems:
List<String> xAxisValues; // YOUR DATA HERE
...
IAxisValueFormatter xAxisFormatter = new IAxisValueFormatter() {
    @Override
    public String getFormattedValue(float value, AxisBase axis) {
        return xAxisValues.get((int) value);
    }
};
...
XAxis xAxis = chart.getXAxis();
xAxis.setTextColor(Color.BLUE));
xAxis.setValueFormatter(xAxisFormatter);
I beleive the above line will match your need, below stuff will be useful may be,
LineDataSet set1 = new LineDataSet(values, title);
set1.setColor(Color.RED); // Your line color
set1.addColor(Color.GRAY); // Your Blue
set1.setCircleColor(Color.BLUE);
set1.setLineWidth(3f); // Increase here for line width
set1.setCircleRadius(10f);
set1.setDrawCircleHole(true);
set1.setValueTextSize(9f);
set1.setDrawFilled(true);
set1.setFormLineWidth(10f);

set1.setFormLineDashEffect(new DashPathEffect(new float[]{10f, 5f}, 0f));
set1.setFormSize(15.f);
Fine tune according to your need in above code see comments The below two lines are important for the smooth line and filled color
set1.setMode(LineDataSet.Mode.CUBIC_BEZIER);
set1.setFillColor(Color.BLUE); // Change your color
For the horizontal issue, please refere to this page
Here, I think it will be :
YourObjettoDrawVariable.getAxisRight().setDrawLabels(false);
But, it is always better to show your code for ccontext purpose. I hope it's help.