Nice question! This is not a complete answer. For a square it's not so bad. It's easier to do the next iteration after the $9$ points by hand, I think. After that, here's a plot of what happens produced by a Python script written by GPT-4o:
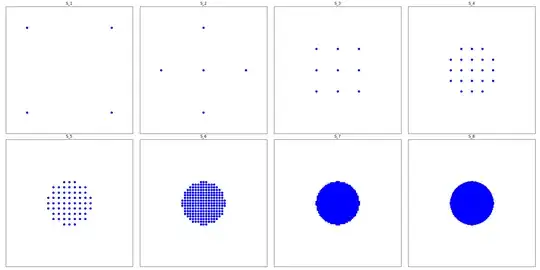
These plots clearly suggest the following, which are not hard to prove by induction:
If the initial points have coordinates $(0, 0), (1, 0), (0, 1), (1, 1)$, then after the $n^{th}$ iteration all points have coordinates with denominators $\frac{1}{2^n}$.
Moreover, at every iteration the points consist of a "boundary" of some points in the lattice $\frac{1}{2^n} \mathbb{Z}^2$, together with all lattice points inside their convex hull.
To compute the next iteration from the previous one we can restrict our attention to drawing line segments between adjacent points in the lattice (including diagonally adjacent), together with all points from the previous iteration except the extreme points.
So it remains to understand the behavior of the boundary. Visually this is clearly converging to a circle (Edit: just kidding, see the comments!); I think the intuitive idea is pretty clear here, repeatedly taking midpoints is smoothing out all the corners. I'm not sure what the cleanest way to actually prove this is, though. I'm also not sure whether the radius converges to a positive constant or to zero. It looks like it might be... $\frac{1}{4}$?
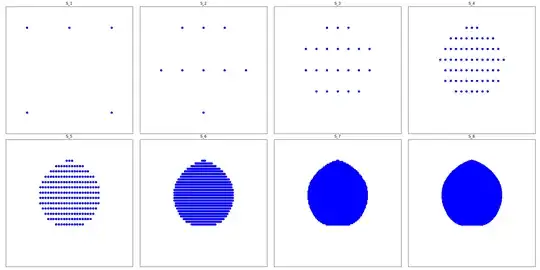
In the general case it seems that a given starting configuration of points converges fairly rapidly to a specific convex set; note that in general if there are $n$ points in a given iteration then the next iteration could have as many as ${n \choose 2}$ points which is really quite a lot so it's hard to be more precise than this. I will stick to points lying on a lattice to keep things manageable. Here's what happens when we start with one additional point added to the square, a midpoint of one side:
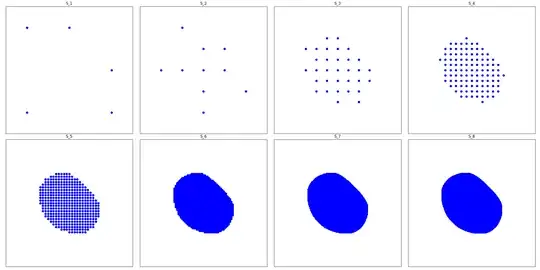
I don't even have a guess about what that limiting shape is. Note that it's flat on the bottom and has a corner at the top, so I was wrong about taking midpoints always smoothing out corners!
Here's what happens when we replace a corner with two side midpoints:
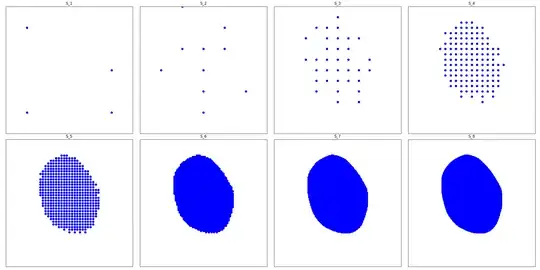
Here's what happens when we move one of those side midpoints up (not pictured in the first iteration but you can see it's still affecting future ones):
In case the link breaks, here's the Python script:
import numpy as np
import matplotlib.pyplot as plt
from itertools import combinations
def compute_midpoints(S):
    """Compute the set of midpoints between all distinct pairs in S."""
    return {(0.5 * (p1[0] + p2[0]), 0.5 * (p1[1] + p2[1])) for p1, p2 in combinations(S, 2)}
def get_initial_points():
    """Return a default set of initial points. Modify this manually if needed."""
    return {(0, 2), (1, 0), (-1, 1), (1, -1), (-1, -1)}
def generate_sequence(n, S1):
    """Generate the sequence S_1, ..., S_n iteratively with custom S1."""
    S = [S1]
    for _ in range(n - 1):
        S.append(compute_midpoints(S[-1]))  # Only midpoints are included
    return S
def plot_sequence(S):
    """Plot each set S_n separately."""
    num_plots = len(S)
    fig, axes = plt.subplots(2, (num_plots + 1) // 2, figsize=((num_plots + 1) // 2 * 6, 12))  # Split into 2 rows
    axes = axes.flatten()
for i, (ax, points) in enumerate(zip(axes, S)):
    points = np.array(list(points))
    ax.scatter(points[:, 0], points[:, 1], c='b', s=40)  # Increased point size
    ax.set_title(f"S_{i+1}")
    ax.set_xlim(-1.5, 1.5)
    ax.set_ylim(-1.5, 1.5)
    ax.set_xticks([])
    ax.set_yticks([])
    ax.set_aspect('equal')

# Hide unused subplots if any
for j in range(i + 1, len(axes)):
    fig.delaxes(axes[j])

plt.tight_layout()
plt.show()


Get custom initial points
S1 = get_initial_points()
Generate and plot the sequence up to S_8
S_sequence = generate_sequence(8, S1)
plot_sequence(S_sequence)


