0

I am unable to plot this graph. Any one please help me to plot?

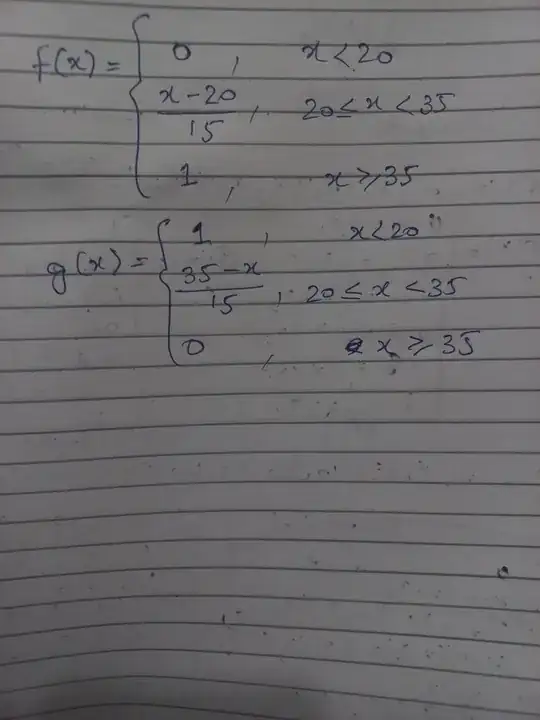
f = double(X<20).* (0) + ...
double(and(X>=20,X<35)).* ((X-20)./15) + ...
double(X>=35).*(1);
g = double(X<20).* (1) + ...
double(and(X>=20,X<35)).* ((35-(X))./(15)) + ...
double(X>=35).*(0);
figure; 
plot(X,f,'r','linewidth',2);
hold on ;
plot(X,g,'b','linewidth',2); xlabel('X');grid on;xticks(2:1:10); 
legnd('f(x)','g(x)')

In other words, I want to plot the following functions:

Royi
  • 10,050
  • Please clarify your specific problem or provide additional details to highlight exactly what you need. As it's currently written, it's hard to tell exactly what you're asking. – Community Jun 12 '23 at 05:49
  • https://www.entechin.com/how-to-plot-a-piecewise-function-in-matlab/?utm_content=cmp-true – Jean Marie Jun 12 '23 at 06:35
  • See here: https://math.stackexchange.com/a/533741/80812 – horchler Jun 12 '23 at 14:20

1 Answers1

0

You may use MATLAB's function handlers.

clear();
close('all');

% Parameters gridMinVal = -10; gridMaxVal = 50; gridNumPts = 10000;

% Grid vX = linspace(gridMinVal, gridMaxVal, gridNumPts); vX = vX(:);

% Functions hFx = @(vX) (0 .* (vX < 20)) + (((vX - 20) / 15) .* ((vX >= 20) & (vX < 35))) + (1 .* (vX >= 35)); hGx = @(vX) (1 .* (vX < 20)) + (((35 - vX) / 15) .* ((vX >= 20) & (vX < 35))) + (0 .* (vX >= 35));

hF = figure(); hA = axes(hF); set(hA, 'NextPlot', 'add'); plot(vX, hFx(vX), 'LineWidth', 3, 'DisplayName', 'f(x)'); plot(vX, hGx(vX), 'LineWidth', 3, 'DisplayName', 'g(x)'); set(get(hA, 'Title'), 'String', {['Piece Wise Functions']}); set(get(hA, 'XLabel'), 'String', {['x']}); set(get(hA, 'YLabel'), 'String', {['y']}); legend();

enter image description here

Royi
  • 10,050