3

I am working on network analysis project at one of our Nation's Service Academies, and I need a little help.

As a starting point, we are looking at a citation network that we build by using the keyword, "Network Analysis", for peer reviewed articles only in Web of Science. We took the top 50 results, and looked at the articles to which those cited and built a citation network. It outputs the information in Bibtex, Tab-Delimited, HTML, Plain Text, End Note, and a few others.

Here is my question:

  • What is the best way to create a citation network?

We have these formats, but it is not usable yet. Ideally, we would have a matrix with article names on the x and y, and binary numbers for the connections. sample data

Joseph Bosse
  • 81
  • 1
  • 5

3 Answers3

2

I don't understand if you want to build a network of authors who cite each other, or a network of papers who cite other papers (which would be a much sparser network because the coauthorship relationships won't show up as edges).

I would follow a strategy similar to this one (off the top of my head):

  1. Assign ids to your papers
  2. Build 2 csv files : papers.csv, citations.csv
  3. read in 2-col csv file "paper.csv" as a two-column data frame: col1: paper_id, col2: title
  4. read in 2-col csv file "citations.csv" as a two-column data frame: col1: paper_id, col2: cites_id,

With R's igraph package, you can construct a network pg (for papers_graph) with (pseudocode)

pg <- igraph::graph_from_data_frame(citations)

Then you assign "vertex attributes" to the nodes in the network:

pg <- set_vertex_attribute(pg, "title", value= papers) 
# same as:  V(pg)$title <- papers$title

(and possibly many other attributes)

Then you can use igraph's many functions (~200) to analyze the network.

For visualizations, you plot the ids, and use a diagram type which gives you the title when you move the mouse over / click on the node symbol (which is labeled only with the id to save screen space). You can use other design elements such as coloring the nodes by release year for instance).

knb
  • 672
  • 5
  • 16
1

Parse an edgelist out of your data, load it into a dataframe with two columns (source, target), then feed that to igraph::graph_from_data_frame

David Marx
  • 3,288
  • 16
  • 23
1

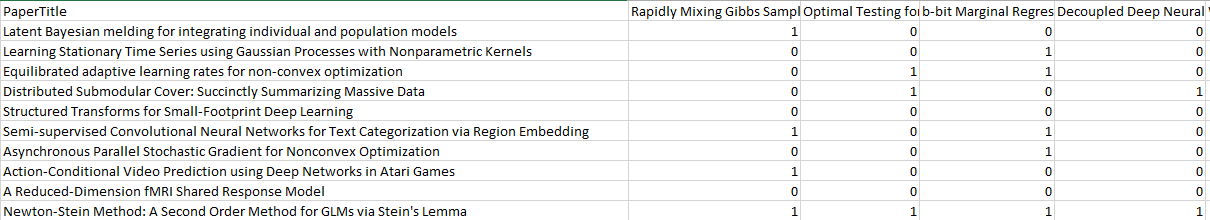
If I understand it correctly, the matrix which was shown(snapshot) was actually generated manually. I'm I correct?, If yes, then the process which you have done is right. For generating the Graphs/Social Network you need to transform the data into Source and Edges(Weights too if possible but not mandatory). I think you already have it ready in that format, by which I mean you where saying that both x and y to be Source/words and Edges as connections (0 or 1).

If considering that the data is ready, then next question is

  1. Are you looking just for Visualizing and deriving insights?

    or

  2. Do you want to do some analysis on the data to find communities and see a how are they distributed/spread within themselves or determine which is a key player etc.

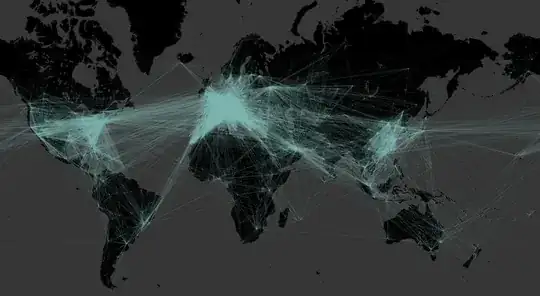
Now answer with respect to question-1, you have tool named Gephi, which can give you amusing visualizations. For example you can see the Link. Can use Tableau, have done something similar to this using Tableau and R.

Airport Connections

With respect to question-2, you can use different algorithms under igraph package in R and get some output. Use different visualization tool for getting insights from the outcome. The link attached gives you idea about different algorithms available in R for performing community detection.

Finally to answer the question for making the data into the sample shown by you, should be done manually. Just to let you know, generally in the life-cycle of any analytics project, It is very likely to spend most of the time in Data Preparation phase(30-50% of time) just to make sure that the data is ready, ignore this if you know this before. I mean, there is no shortcut/easy path for for preparing the data.

Please go through this Link, to know how network analysis would help us in getting good insights but it is respective to finance industry. It might help you to derive similar insights.

This Link, would help you to understand the scope of Network Analysis. This analysis was done by one of my friend during our course work. I was really amused by the insight which he could derive from the analysis. Probably you could also perform something similar. Just sharing this link for your reference.

Toros91
  • 2,392
  • 3
  • 16
  • 32