4

About 9% of the US population have a diabetes diagnosis. So a binary random classifier that just guesses 50% positive and 50% negative would

  • likely be incorrect when it guesses positive (leading to more False Positives (FP) than True Positives (TP); FP > TP), and;
  • likely be correct when it guesses negative (leading to more True Negatives (TN) than False Negatives (FN); TN > FN).

Given all this, would the ROC curve of such random classifier still be a diagonal? Even if the data itself is biased toward negative diagnosis?


I'm following along to an Azure AI Fundamentals course which states

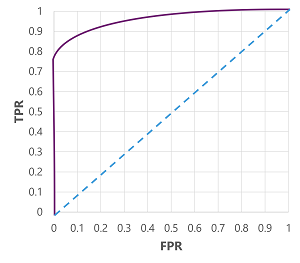
The ROC curve for a perfect model would go straight up the TPR axis on the left and then across the FPR axis at the top. Since the plot area for the curve measures 1x1, the area under this perfect curve would be 1.0 (meaning that the model is correct 100% of the time). In contrast, a diagonal line from the bottom-left to the top-right represents the results that would be achieved by randomly guessing a binary label; producing an area under the curve of 0.5. In other words, given two possible class labels, you could reasonably expect to guess correctly 50% of the time.

The image below is from the same link. The dotted blue line represents ROC of the random classifier.

enter image description here

joseville
  • 143
  • 3

1 Answers1

8

Yes, it will still be diagonal.

The random model baseline predicts a probability between (0, 1) for each item.

Recall the definitions of TPR and FPR

TPR: $\frac{TP}{TP + FN}$

FPR: $\frac{FP}{FP + TN}$

Say we have a dataset with $N_{pos}$ positive items and $N_{neg}$ negative items. We predict a random probability for each item. We then select a cutoff threshold $t$ to evaluate our TPR and FPR, where $t$ is between (0, 1).

Since our predictions are random, our positive items have $(1-t)*N_{pos}$ predicted positives (TP) and $t*N_{pos}$ predicted negatives (FN). This gives us a TPR of $\frac{(1-t)*N_{pos}}{(1-t)*N_{pos} + t*N_{pos}} = 1-t$

For the negatives it is the same. We have $(1-t)*N_{neg}$ predicted positives (FP) and $t*N_{neg}$ predicted negatives (TN). This gives us a FPR of $\frac{(1-t)*N_{neg}}{(1-t)*N_{neg} + t*N_{neg}} = 1-t$

Because of this, TPR = FPR for a random classifier for all values of $t$. Thus, the ROC curve is diagonal.

You can also simulate this:

import numpy as np
import matplotlib.pyplot as plt
import sklearn.metrics as metrics

generate data

n = 500 pct_neg = 0.9 y_test = np.random.rand(n) > pct_neg # labels 0 or 1 y_pred = np.random.rand(n) # random predictions

calculate FPR, TPR

fpr, tpr, threshold = metrics.roc_curve(y_test, y_pred) roc_auc = metrics.auc(fpr, tpr)

plot

plt.plot(fpr, tpr, 'b', label = 'AUC = %0.2f' % roc_auc) plt.legend(loc = 'lower right') plt.plot([0, 1], [0, 1],'r--') plt.xlim([0, 1]) plt.ylim([0, 1]) plt.ylabel('True Positive Rate') plt.xlabel('False Positive Rate') ```

Karl
  • 1,176
  • 5
  • 7